How do I use Eventfrog Analytics to evaluate statistics for my events?
With Analytics in the Eventfrog Cockpit, you have all the important figures for your events in one place. This allows you to see at a glance how successful your events are – from ticket sales and revenue and buyer information.
Where can I find Analytics?
In the Cockpit, you will find the ‘Analytics’ section in the left-hand menu.
Under Analytics, you will find:
- Overview – key figures and graphs
- Revenue – detailed evaluations of ticket and Cashless revenue
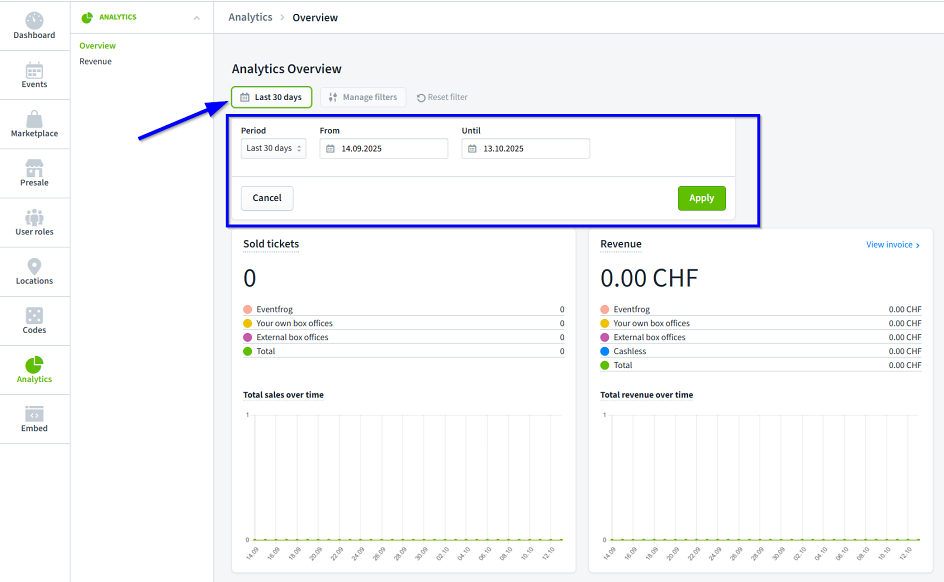
Select a time period
Determine the time period for which you want to view statistics. Various filters are available for this purpose:
- Today, yesterday, last 7 or 30 days
- Last week, last month
- This year or last year
- Entire period
- Or individually via a user-defined date
For example, you can check how many tickets you sold last month or how much revenue your events generated in a specific year.
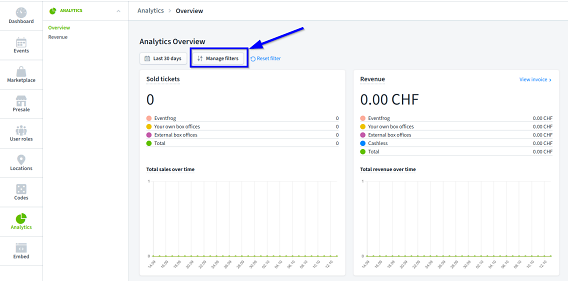
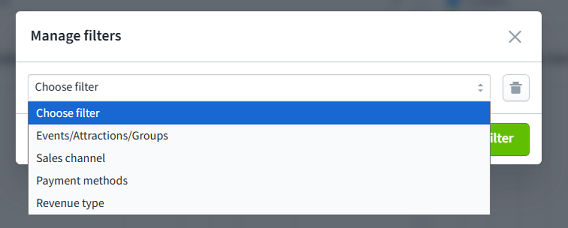
Manage filters
You can further narrow down your evaluations using the filter function.
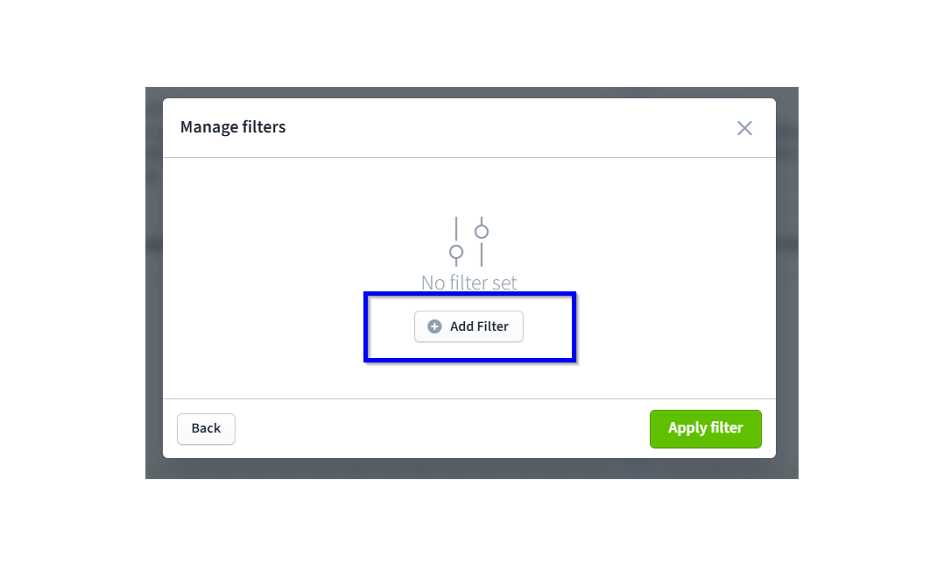
Possible filters are:
- Events / attractions / groups
- Sales channel (Eventfrog online, own or public box offices)
- Payment methods (via Eventfrog, on site, prepayment)
- Revenue types (tickets or Cashless)
You can combine multiple filters and remove them again at any time.
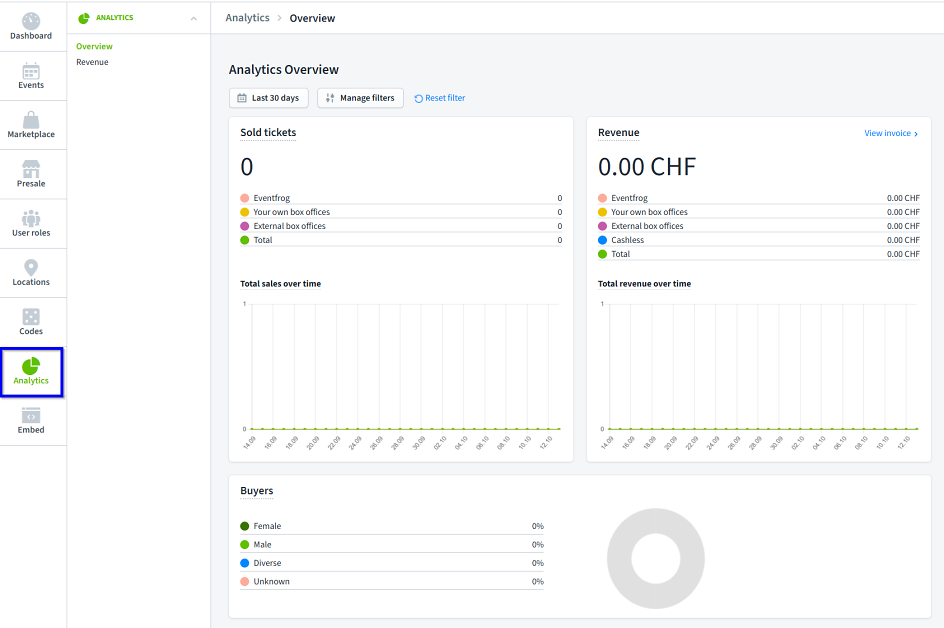
The Analytics Overview
The overview page shows you the most important statistics:
Tickets sold
- Total number
- Breakdown by sales channels
- Development over time
Revenue
- Total gross revenue (tickets & Cashless)
- Breakdown by sales channels
- Trend over the selected period
Buyers
- Distribution by gender (f/m/d/unknown)
Roles & access rights
- Event organisers, event managers and assistants: Access to all statistics for the events they are authorised for.
- Box offices: Access only to the ‘Revenue’ section.